In this month’s CIO monthly, we take a look at the outlook for Australia’s residential sector. Housing momentum has turned quickly in the wake of the first interest rate hike in early May. While home prices and building activity have typically proved resilient during recent downturns, a rapid rise in interest rates has dented buyer demand, hurt affordability, and is likely to weigh on consumer spending (and prices) in the year ahead as debt servicing costs lift sharply.
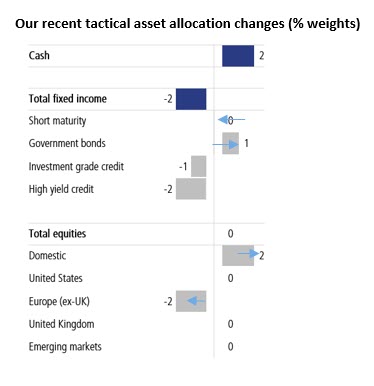
In this edition, we also highlight some changes to our tactical asset allocation positioning this month. While remaining neutral equities, we have increased our relative overweight to domestic equities via a move further underweight Europe. Though we remain underweight fixed income via our credit positioning, we are modestly lengthening our duration with a small overweight to government bonds (funded from short maturity), continuing our up-weighting of this asset class.
Volatility has persisted over recent months. A number of the key signals we believed were required to embrace a more constructive view on risk assets have been progressively achieved, with inflation tentatively peaking in the US, commodity prices moderating, and a number of central banks moving more data-dependent (reducing the risk of overtightening and recession). But rather than stabilising markets, this underpinned an arguably premature pricing of US rate cuts in early 2023, driving an unexpected rally in US equities from mid-June to mid-August of 17% to pre-pandemic peak valuations (see Recent rally leaves global equities vulnerable, published in mid-August, where we cautioned on valuations).
We do not expect interest rates to be cut in the US, Europe, UK or Australia before late 2023 at the earliest. At least for the US, this is a view supported by US Federal Reserve (Fed) Chair Powell at his late-August Jackson Hole address. Indeed, his comments led to a reversal in a significant amount of the equity rally and a noticeable move higher in bond yields above 3%.
Reflecting this and ongoing elevated volatility, we remain neutral equities. However, we have increased our overweight to domestic equities relative to global equities. The larger global underweight is reflected by a greater underweight to Europe. As winter approaches in Europe, energy supplies remain uncertain, consumer energy prices are set to spike, and the risk of recession has increased as consumer and business confidence weakens.
We have also taken the opportunity to extend our recently more favourable view toward government bonds by moving modestly overweight. We’ve funded this by closing our short maturity overweight (adding slightly to our duration). We remain overweight cash, funded by our underweight to credit, with the view to deploying to risk assets should conditions permit.

Source: LGT Crestone Wealth Management. Units refer to the percentage point deviation from strategic asset allocations. Investment grade credit includes Australian listed hybrid securities.
A number of analysts have recently forecast that housing prices will correct lower by more than 20% in the year ahead. In the past, the housing sector has proved relatively resilient, with prices often falling by only 5-10% after multiple years of double-digit growth. However, with the Reserve Bank of Australia (RBA) hiking rates relatively rapidly since May this year (and in many cases doubling the interest rate repayment on loans over a six-month period), housing prices, sales, auction clearance rates, and sentiment have all fallen over the past few months.
To a significant extent, the outlook for residential activity will be determined by just how ‘sticky’ inflation proves to be and how high the RBA takes the cash rate this cycle. This will materially impact affordability for both first homeowners and ‘upgraders’. The extent to which higher debt servicing slows consumer spending and leads to an increase in unemployment (and an increased cohort of forced sellers) will also be important. Finally, the pace at which immigration recovers will also be key, particularly for new construction demand beyond the coming year or so.
It can also be helpful to differentiate between the prices and turnover associated with the ‘established’ housing market and building construction activity for the ‘new’ housing segment:
As discussed, the extent to which the RBA lifts rates will be key to the outlook for established housing in the near term. Current market pricing is for the cash rate to rise from 1.85% now to 3.25% by the end of this year, peaking at 3.8% in mid-2023 before being reduced to 3.65% at the end of 2023. Such a scenario would likely lead to a more significant correction in housing activity than most forecasted central cases. The consensus of economists has a lower peak for the RBA cash rate of 3.05%, while CBA and UBS forecast lower peaks of 2.60% and 2.85% respectively. The importance of this is reflected in the following chart.
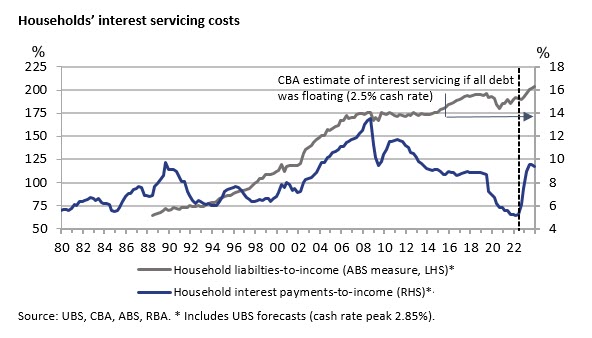
Because of falling borrowing rates during the past decade, the amount of household debt (led by new lending) has remained elevated and rebounded over the last couple of years to record high levels of around 180% of income (among the highest in the world). This has reflected the sharp drop in interest servicing costs, which plummeted from around 9% of income from 2019 to about 5% in 2021. However, with a relatively rapid rate increase cycle unfolding, UBS expects this to rebound to over 10% (the highest in over a decade with the cash rate at just 2.6%). CBA estimates it will rise toward pre-GFC peaks as borrowers come off fixed interest rate loans.
On the one hand, the higher share of fixed rate loans (now 35% compared to typically 20% in the past) will see the household interest burden rise more gradually. But as the RBA notes, “around one-quarter of total housing credit comprises loans with a fixed-rate period due to end in the next two years”, most notably in H1 2023, a more concentrated ‘roll-off’ than usual.
Over recent months, there have been clear signs of weakness in the housing sector as official interest rates have risen, lifting variable borrowing rates, as well as powering sharp increases in available one-to-three-year fixed rates. This has led to falling home sales (-16% according to CoreLogic) and falling auction clearance rates (from around 80% to a little over 50%), as affordability and the ability to service expected future loan repayments has deteriorated.
Price growth over the past year is still positive, with data to the end of July showing prices in the five major capital city still up 5.2% (with Sydney up 1.6% and Melbourne up 0.3%). However, the five major capitals have seen significant falls from the peaks earlier in the year. Melbourne is down a little over 4%, while Sydney is down over 7%.
Looking ahead, in the debate about the outlook for housing prices over the coming year, there is a range of positives and negatives:
It is likely too early to be certain whether the positives or negatives will ultimately dominate over the coming year. However, with global inflation showing signs of peaking as commodity prices correct lower, this may limit the risk that central banks, including the RBA, will over- tighten in the period ahead. While inflation in Australia is likely to keep rising until late 2022 and official interest rates have further to rise, Australia is widely seen as one of the least likely economies to enter recession over the coming year, even as growth continues to slow noticeably in coming quarters. According to CBA, the unemployment rate (currently 3.4%) is expected to rise to an average of 4.0% in 2023, while UBS forecasts a rise to 4.3% by end- 2023. At well below prior cycle peaks, this suggests a limited risk of housing becoming a systemic event (and suggests a ‘shallow’, albeit potentially elongated, bad debt cycle for banks).
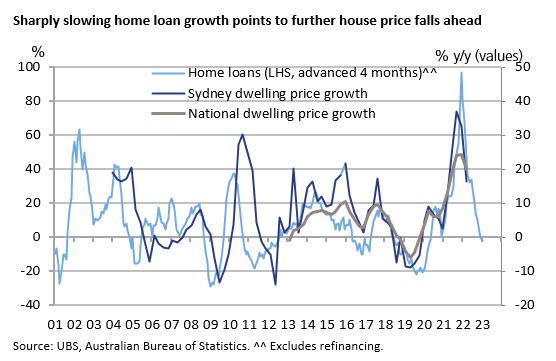
For now, one of the key leading indicators for prices—home loan growth—suggests further weakness in the next six months (see the chart below). Sydney’s and Melbourne’s annual price growth has slowed from around 30% earlier in the year to 10-15% now. The slowing in loan growth suggests a further deceleration to at least zero, with the likelihood this will extend to about a 10% fall in prices (moderately worse than the national 7-8% decline in both 2009 and 2019). This is consistent with our expectations for loan growth to fall 20% over the coming year.

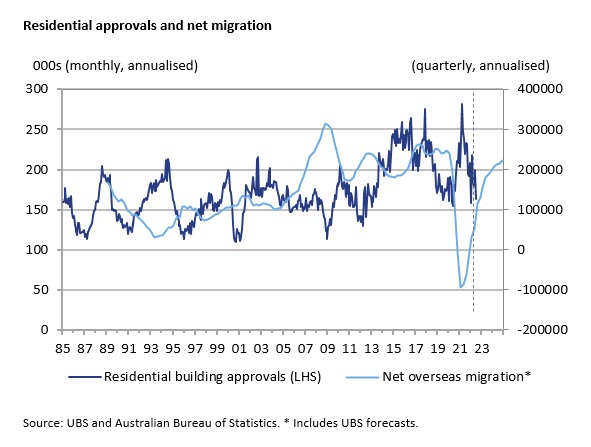
As the RBA noted recently, “a number of factors – including government policy measures, low interest rates and an apparent shift in preferences towards more space as people spent more time at home during the pandemic – supported demand for new housing and renovations over the past few years.” This has underpinned a solid uplift in building approvals in 2021, totalling around 229,000, which is 25% higher than the average through 2019 and 2020 of 181,000.
Together with both materials and labour shortages, this is likely to support activity in the construction sector during 2022. Indeed, approvals this year have remained relatively resilient, easing to a 200,000 pace mid-year (and 180,000 early in H2). According to UBS, after a 9.7% uplift in real activity during 2021, a fall of only 0.5% is expected this year and 1.1% in 2023. CBA forecasts more significant, but still moderate, declines of 2.6% in 2022 and 2.3% in 2023.
Beyond the next 18 months, where there is a significant backlog of work yet to be done, the outlook for new construction activity will significantly depend on both the path of the economy (how high interest rates go and their impact on both affordability and the unemployment rate), as well as the pace at which net overseas migration recovers, typically a key driver of population growth and underlying housing demand.
Overseas migration will only support housing over time, as it’s not surprising that it would take some time for overseas workers to decide to migrate in the wake of global events like a pandemic. But recent trends have been encouraging. While very lagged, data reveal Australia’s population growth last year accelerated from almost nothing to 0.5% by December (still below our longer-term average of around 1.5%). And as CBA notes, net overseas migration contributed to that growth in Q4 for the first time since the pandemic, with 29,100 net new arrivals.
While the outlook for housing remains uncertain, challenged by rising rates but supported by low unemployment, a number of post-pandemic trends have emerged that are worth watching:

IMPORTANT NOTE
This document has been prepared by LGT Crestone Wealth Management Limited (ABN 50 005 311 937, AFS Licence No. 231127) (LGT Crestone Wealth Management). The information contained in this document is of a general nature and is provided for information purposes only. It is not intended to constitute advice, nor to influence a person in making a decision in relation to any financial product. To the extent that advice is provided in this document, it is general advice only and has been prepared without taking into account your objectives, financial situation or needs (your Personal Circumstances). Before acting on any such general advice, we recommend that you obtain professional advice and consider the appropriateness of the advice having regard to your Personal Circumstances. If the advice relates to the acquisition, or possible acquisition of a financial product, you should obtain and consider a Product Disclosure Statement (PDS) or other disclosure document relating to the financial product before making any decision about whether to acquire it.
Although the information and opinions contained in this document are based on sources we believe to be reliable, to the extent permitted by law, LGT Crestone Wealth Management and its associated entities do not warrant, represent or guarantee, expressly or impliedly, that the information contained in this document is accurate, complete, reliable or current. The information is subject to change without notice and we are under no obligation to update it. Past performance is not a reliable indicator of future performance. If you intend to rely on the information, you should independently verify and assess the accuracy and completeness and obtain professional advice regarding its suitability for your Personal Circumstances.
LGT Crestone Wealth Management, its associated entities, and any of its or their officers, employees and agents (LGT Crestone Group) may receive commissions and distribution fees relating to any financial products referred to in this document. The LGT Crestone Group may also hold, or have held, interests in any such financial products and may at any time make purchases or sales in them as principal or agent. The LGT Crestone Group may have, or may have had in the past, a relationship with the issuers of financial products referred to in this document. To the extent possible, the LGT Crestone Group accepts no liability for any loss or damage relating to any use or reliance on the information in this document.
This document has been authorised for distribution in Australia only. It is intended for the use of LGT Crestone Wealth Management clients and may not be distributed or reproduced without consent. © LGT Crestone Wealth Management Limited 2022.
